Election Fraud in North Carolina’s North Congressional District
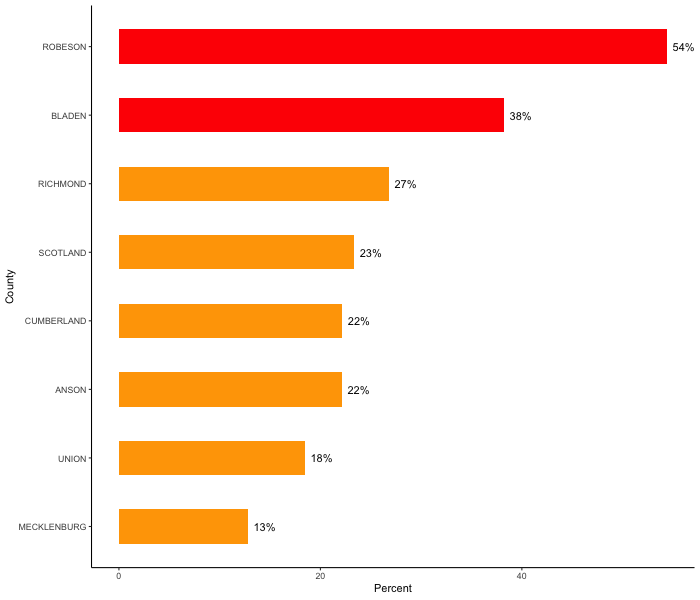
The chart and table below highlight the election fraud that occurred in the 9th Congressional district in North Carolina during the 2018 midterm elections. Through his analysis of North Carolina election data reported the North Carolina State Board of Elections, Michael Bitzer , a political scientist at Catawba College and a blogger at Old North State Politics, played a key role in highlighting the irregularities that occurred in the 9th District. Data for two counties in the District, Bladen and Robeson, showed much higher rates of mail-in ballots not being returned by voters who requested them. The chart below replicates Bitzer’s and the table that follows it provides information on each counties unreturned percentage.
Counties in the 9th Congressional District
Percent Mail Ballots Not Returned
The Percentage of Mail-in Ballots Not Returned in Each NC County
The table below shows the percentage of ballots not returned in each of North Carolina’s 100 counties. The figures are calculate from data reported by the NC State Board of Elections. As the data show, Bladen and Robeson had the highest rates of unreturned mail-in ballots in the state, not just the 9th District.
| County | NotReturned |
|---|---|
| ALAMANCE | 13.523573200993 |
| ALEXANDER | 9.1703056768559 |
| ALLEGHANY | 6.9565217391304 |
| ANSON | 22.147651006711 |
| ASHE | 7.182320441989 |
| AVERY | 9.2024539877301 |
| BEAUFORT | 19.700748129676 |
| BERTIE | 21.985815602837 |
| BLADEN | 38.236977676016 |
| BRUNSWICK | 15.153631284916 |
| BUNCOMBE | 13.598673300166 |
| BURKE | 15.151515151515 |
| CABARRUS | 13.991291727141 |
| CALDWELL | 15.473887814313 |
| CAMDEN | 10.10101010101 |
| CARTERET | 17.065390749601 |
| CASWELL | 13.471502590674 |
| CATAWBA | 13.866666666667 |
| CHATHAM | 10.224089635854 |
| CHEROKEE | 17.630057803468 |
| CHOWAN | 15.652173913043 |
| CLAY | 8.59375 |
| CLEVELAND | 16.764705882353 |
| COLUMBUS | 27.580071174377 |
| CRAVEN | 11.705069124424 |
| CUMBERLAND | 22.185089974293 |
| CURRITUCK | 13.127413127413 |
| DARE | 12.784588441331 |
| DAVIDSON | 15.467289719626 |
| DAVIE | 16.064981949458 |
| DUPLIN | 20.192307692308 |
| DURHAM | 16.485638426261 |
| EDGECOMBE | 21.717171717172 |
| FORSYTH | 15.612340292926 |
| FRANKLIN | 16.491596638656 |
| GASTON | 16.304952698943 |
| GATES | 23.364485981308 |
| GRAHAM | 6.7796610169491 |
| GRANVILLE | 16.898148148148 |
| GREENE | 10.9375 |
| GUILFORD | 12.709116846064 |
| HALIFAX | 23.056994818653 |
| HARNETT | 18.238636363636 |
| HAYWOOD | 8.0441640378549 |
| HENDERSON | 11.135181975737 |
| HERTFORD | 25.862068965517 |
| HOKE | 21.380846325167 |
| HYDE | 5.4545454545454 |
| IREDELL | 20.024235080279 |
| JACKSON | 13.404825737265 |
| JOHNSTON | 15.782122905028 |
| JONES | 21.212121212121 |
| LEE | 11.850311850312 |
| LENOIR | 15.714285714286 |
| LINCOLN | 13.037974683544 |
| MACON | 8.3788706739526 |
| MADISON | 14.351851851852 |
| MARTIN | 12.5 |
| MCDOWELL | 13.857677902622 |
| MECKLENBURG | 12.811778290993 |
| MITCHELL | 12.5 |
| MONTGOMERY | 27.361563517915 |
| MOORE | 13.734335839599 |
| NASH | 15.287244401169 |
| NEW HANOVER | 15.564342199856 |
| NORTHAMPTON | 21.393034825871 |
| ONSLOW | 20.838183934808 |
| ORANGE | 14.63753035033 |
| PAMLICO | 14.110429447853 |
| PASQUOTANK | 14.540059347181 |
| PENDER | 16.741071428571 |
| PERQUIMANS | 24.193548387097 |
| PERSON | 14.222222222222 |
| PITT | 19.894498869631 |
| POLK | 9.9750623441396 |
| RANDOLPH | 13.288288288288 |
| RICHMOND | 26.814516129032 |
| ROBESON | 54.418413481299 |
| ROCKINGHAM | 20.180722891566 |
| ROWAN | 15.804935370153 |
| RUTHERFORD | 19.58041958042 |
| SAMPSON | 20.37037037037 |
| SCOTLAND | 23.359580052493 |
| STANLY | 16.440422322775 |
| STOKES | 11.612903225806 |
| SURRY | 16.647662485747 |
| SWAIN | 18.045112781955 |
| TRANSYLVANIA | 8.8512241054614 |
| TYRRELL | 27.272727272727 |
| UNION | 18.472515856237 |
| VANCE | 20.655737704918 |
| WAKE | 13.977302952389 |
| WARREN | 7.6190476190476 |
| WASHINGTON | 16.822429906542 |
| WATAUGA | 10.696517412935 |
| WAYNE | 16.753926701571 |
| WILKES | 11.257035647279 |
| WILSON | 17.047184170472 |
| YADKIN | 8.9928057553957 |
| YANCEY | 12.012012012012 |